Using Automations
Create recurring research widgets that gather data, track changes, and deliver reports on a daily or weekly schedule.
Open the Automations page
Click Automations in the sidebar. This opens the Automations dashboard where all your recurring research widgets live.
Organization requirement: Automations unlock only when your user belongs to an organization. If you don’t see it enabled, first join or create an organization.

Create a new widget
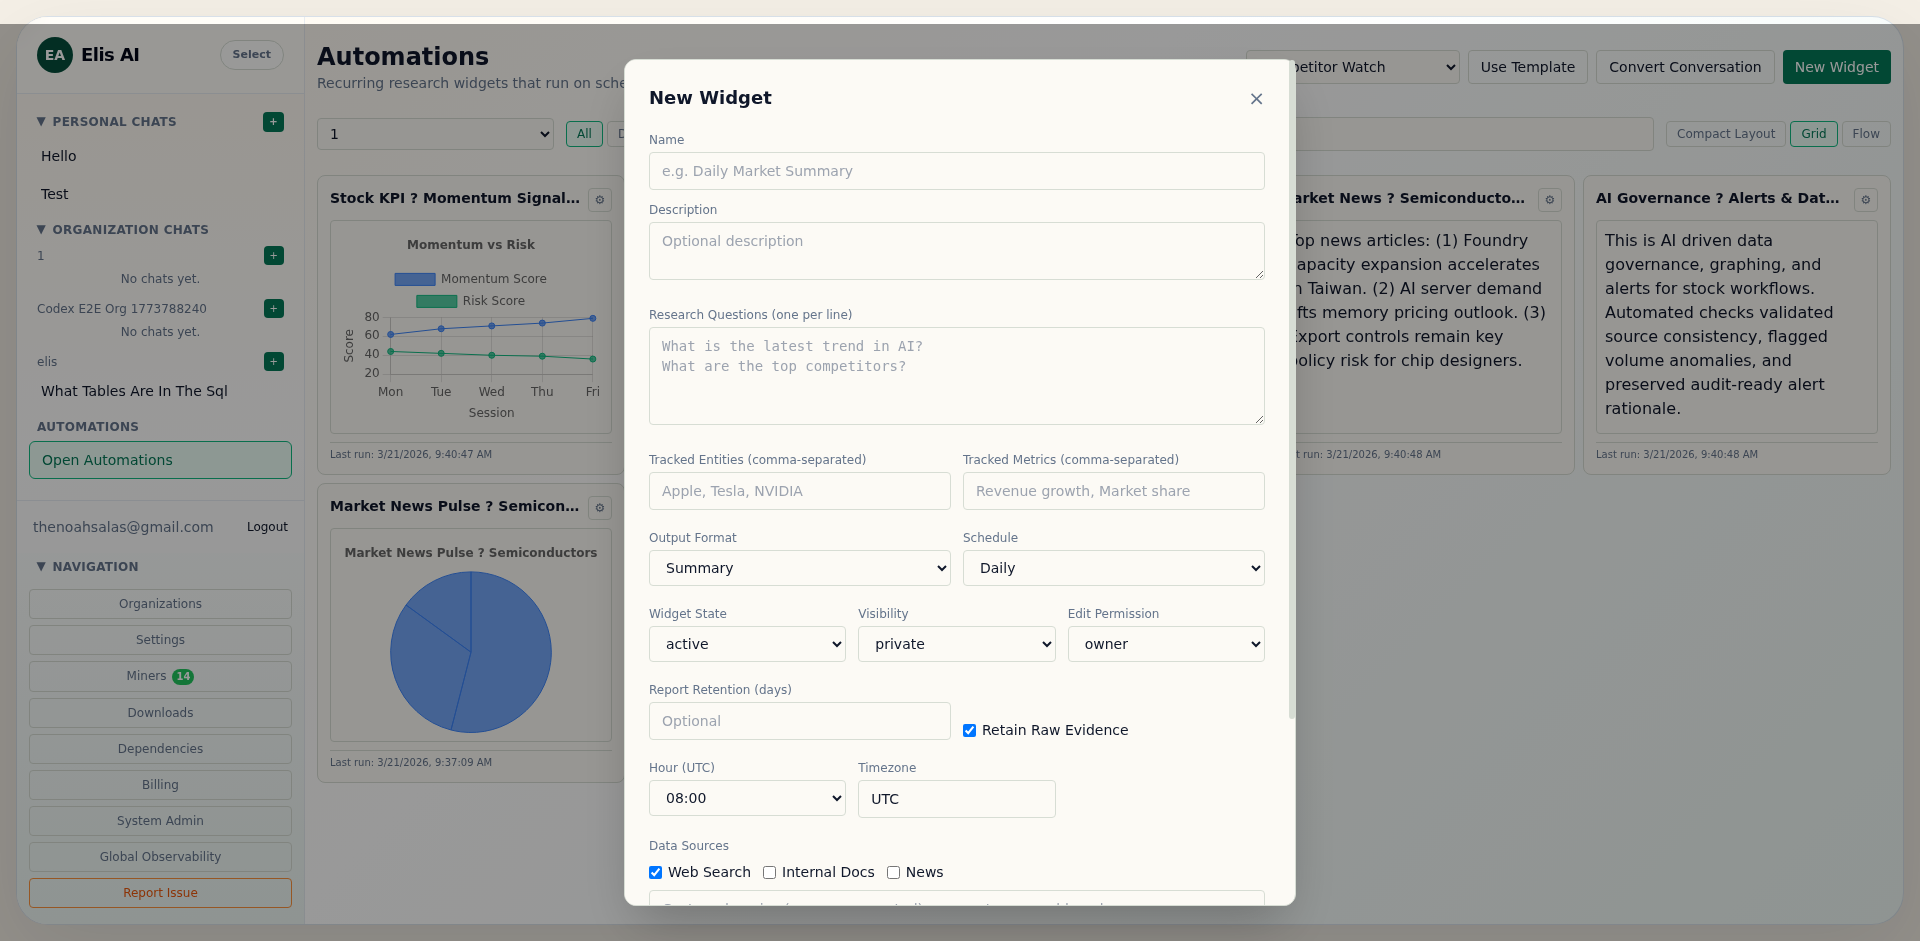
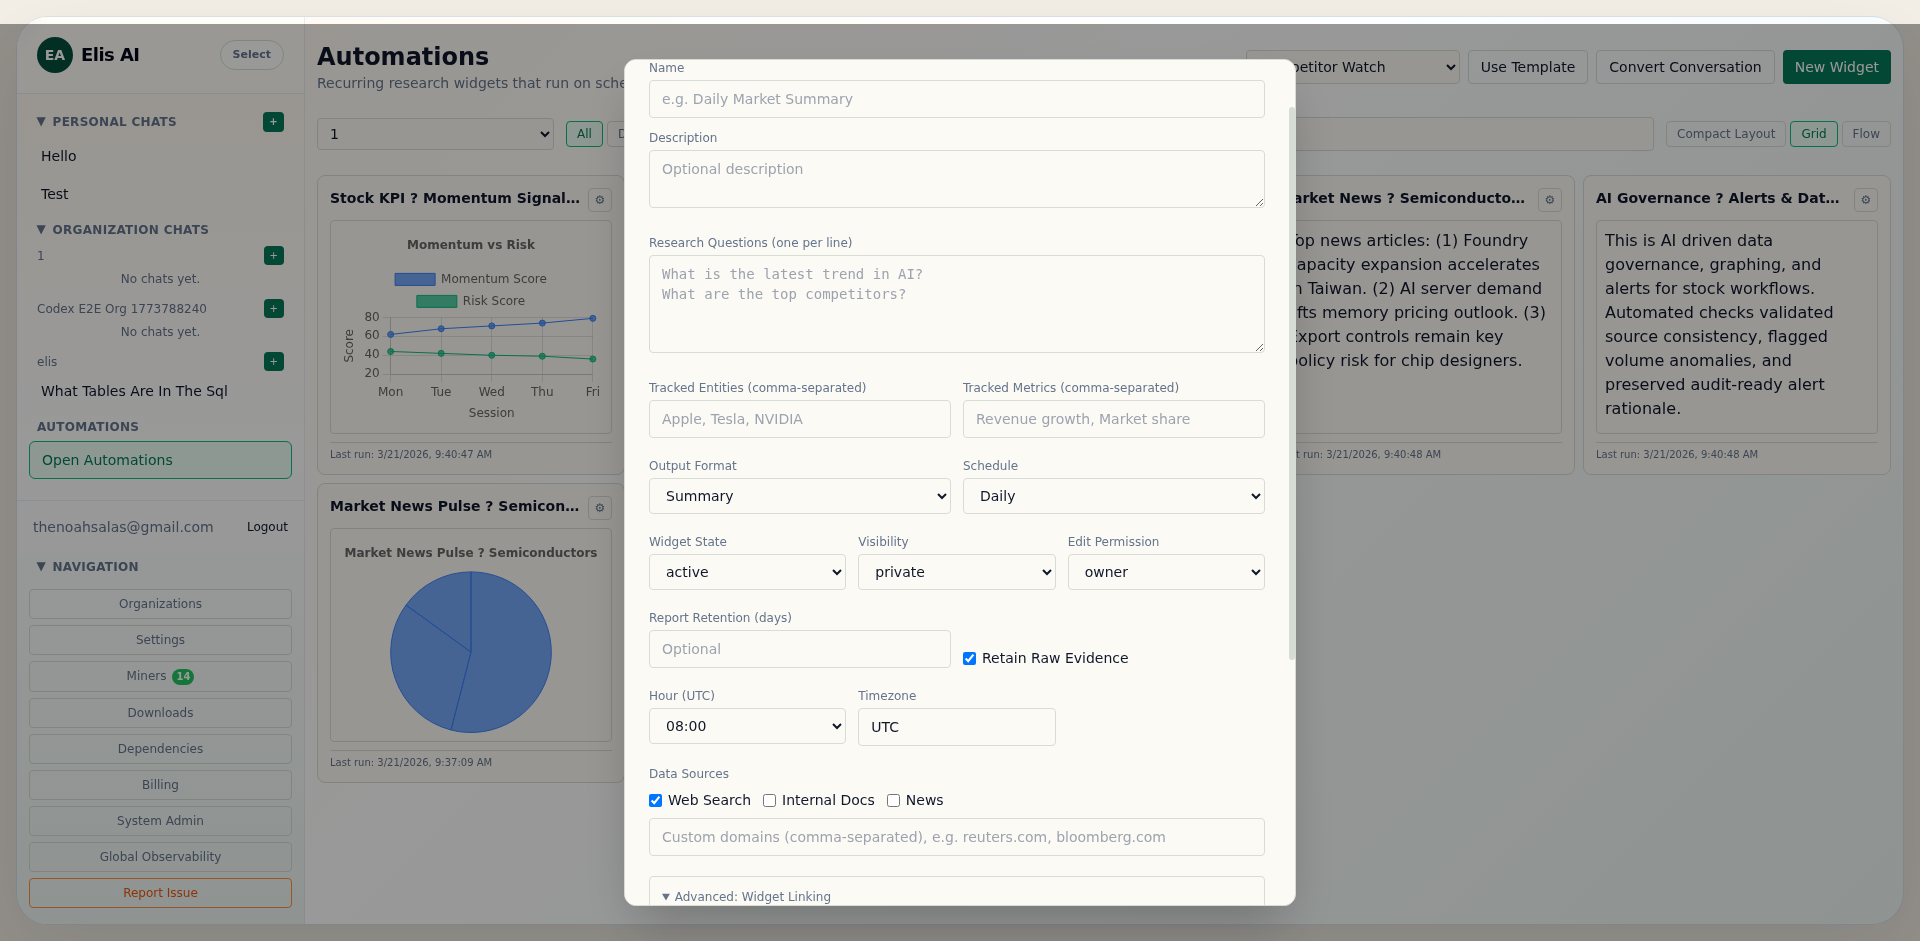
Click the New Widget button in the top-right corner of the dashboard. A form opens where you configure what the widget researches:
- Name & Description — Give the widget a clear label.
- Questions — The research questions answered each run (one per line).
- Tracked Entities — Companies, products, or topics to monitor.
- Tracked Metrics — KPIs like revenue, growth rate, market share.
- Output Format — Summary, chart, table, or mixed.
- Default Chart Type — 📊 Bar, 📈 Line, 🥧 Pie, 🍩 Donut, 🕸️ Radar, 📋 Table, or 📝 Text.
- Schedule — Every 15 min, 30 min, hourly, 4-hourly, 8-hourly, daily, or weekly — with time and timezone.
- Data Sources — Web search, uploaded docs, news feeds, or organization datasources (APIs, SQL databases, REST endpoints).
You can also choose Use Template to start from a prebuilt workflow like Competitor Watch, KPI Tracker, News Monitor, or Executive Brief.
The dashboard is mobile-aware, so filters/actions stack and widget cards remain usable on smaller screens.
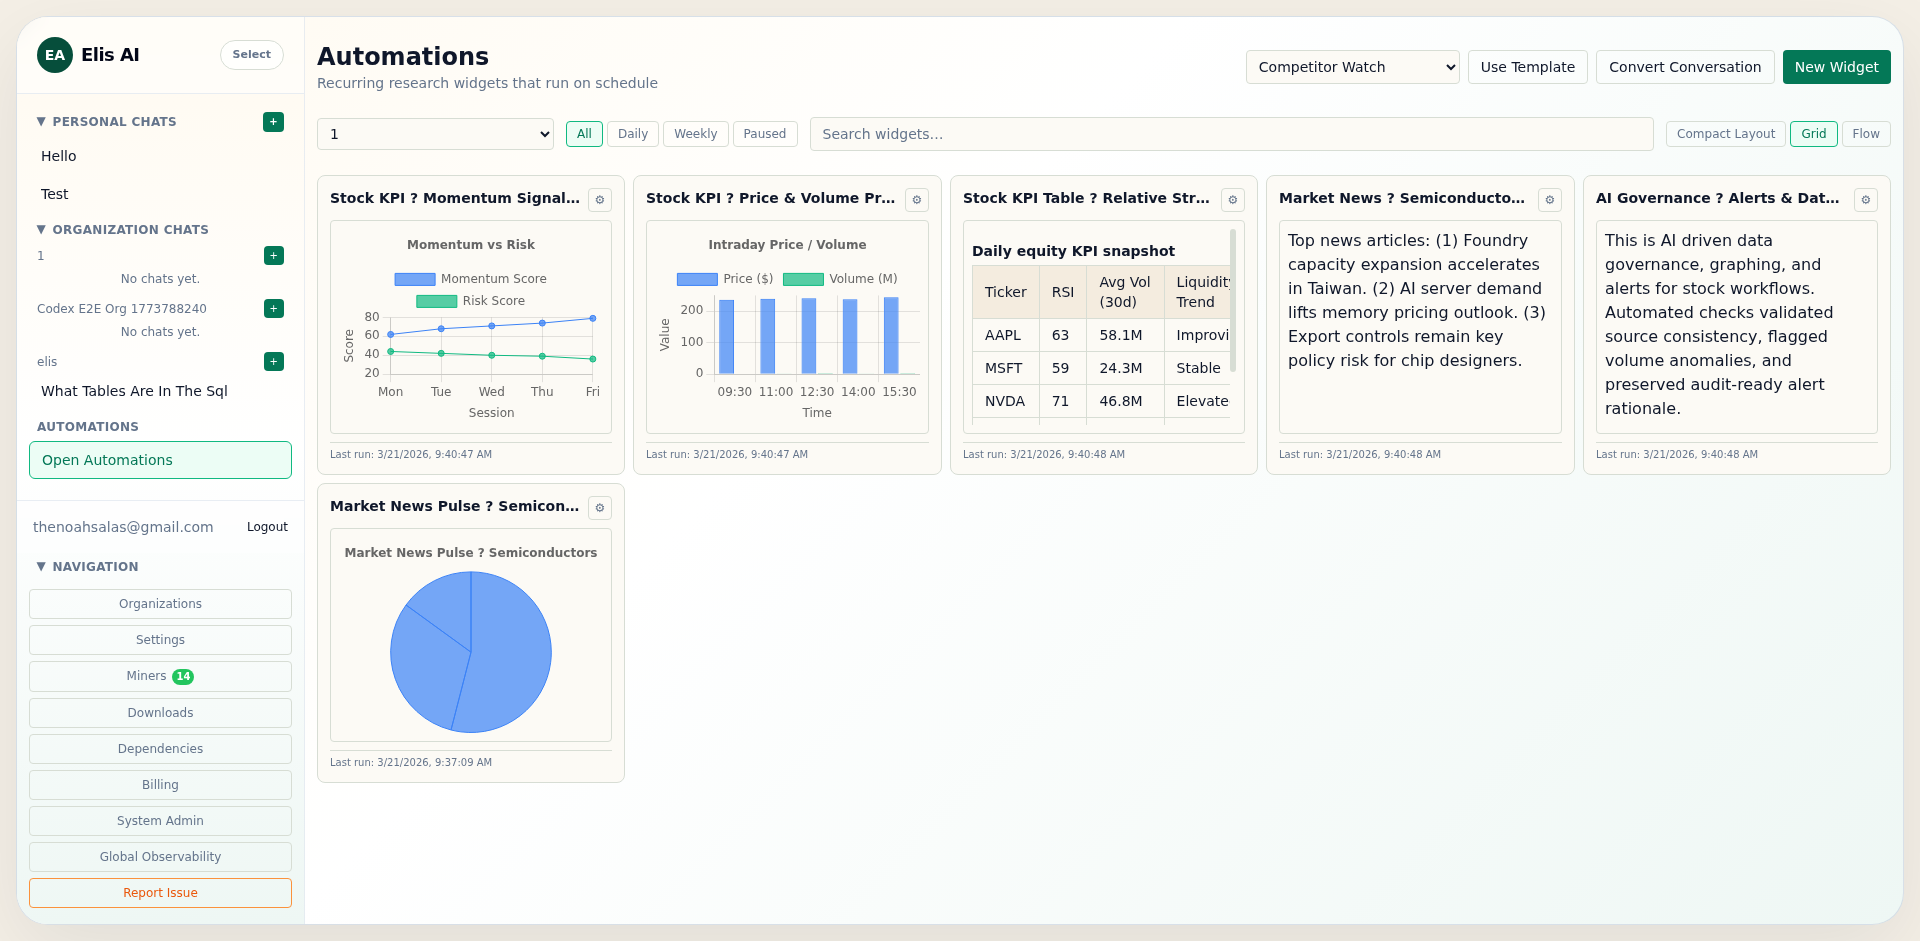
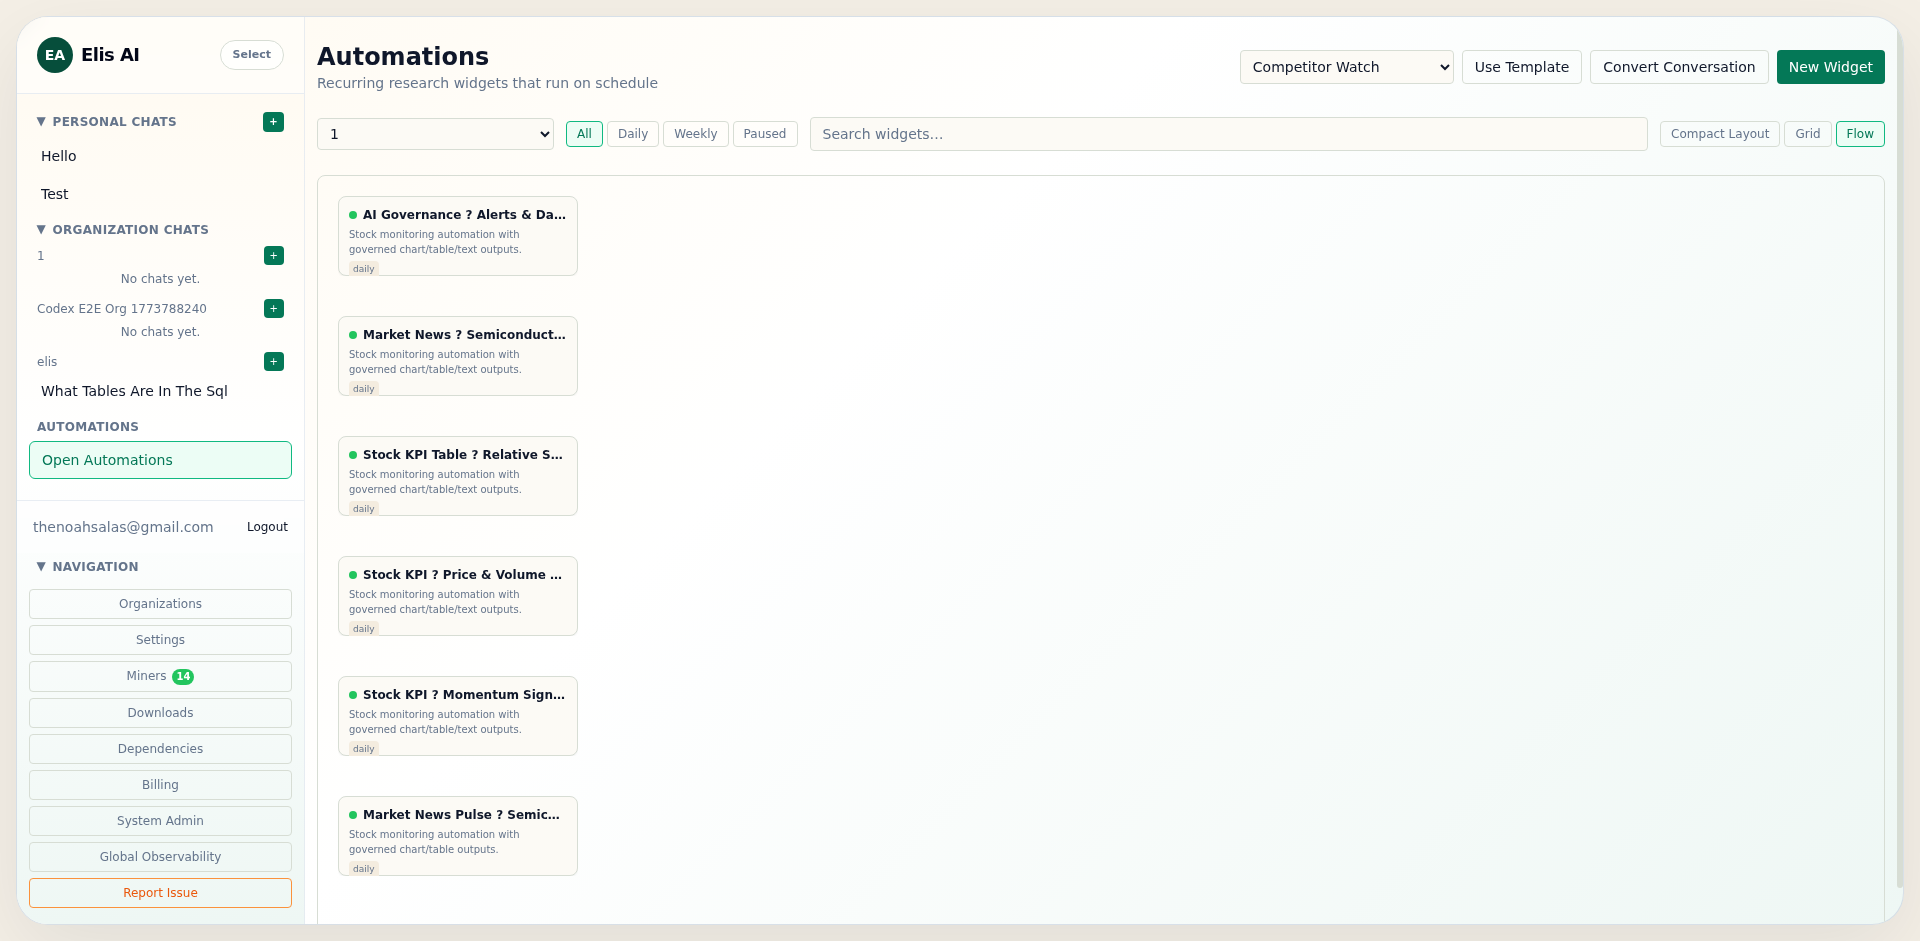
View the widget grid
After creating your widget, it appears as a card in the dashboard grid. Each card shows the widget name, cadence, status badge, and action buttons. Use the filter tabs to show only daily, weekly, or paused widgets.
- Widget states: draft, active, paused, errored, stale, archived.
- Health stats: last success, failure streak, and average runtime.
- Config version: each config edit increments version for run/report traceability.

Run a widget manually
Click Run Now on any widget card to trigger an immediate execution. The widget’s status changes to “running” and a new run appears in the history. Scheduled runs also happen automatically at the configured time.
View reports and deltas
Click History on a widget card to open the detail drawer. The drawer has three tabs:
- Overview — Widget configuration, latest report, and change summary.
- Runs — History of all executions with status and duration.
- Reports — Full output blocks with expandable delta view showing what changed between runs.
Run status and report status are tracked separately. A run can succeed while the report is partial or empty depending on source availability and findings.

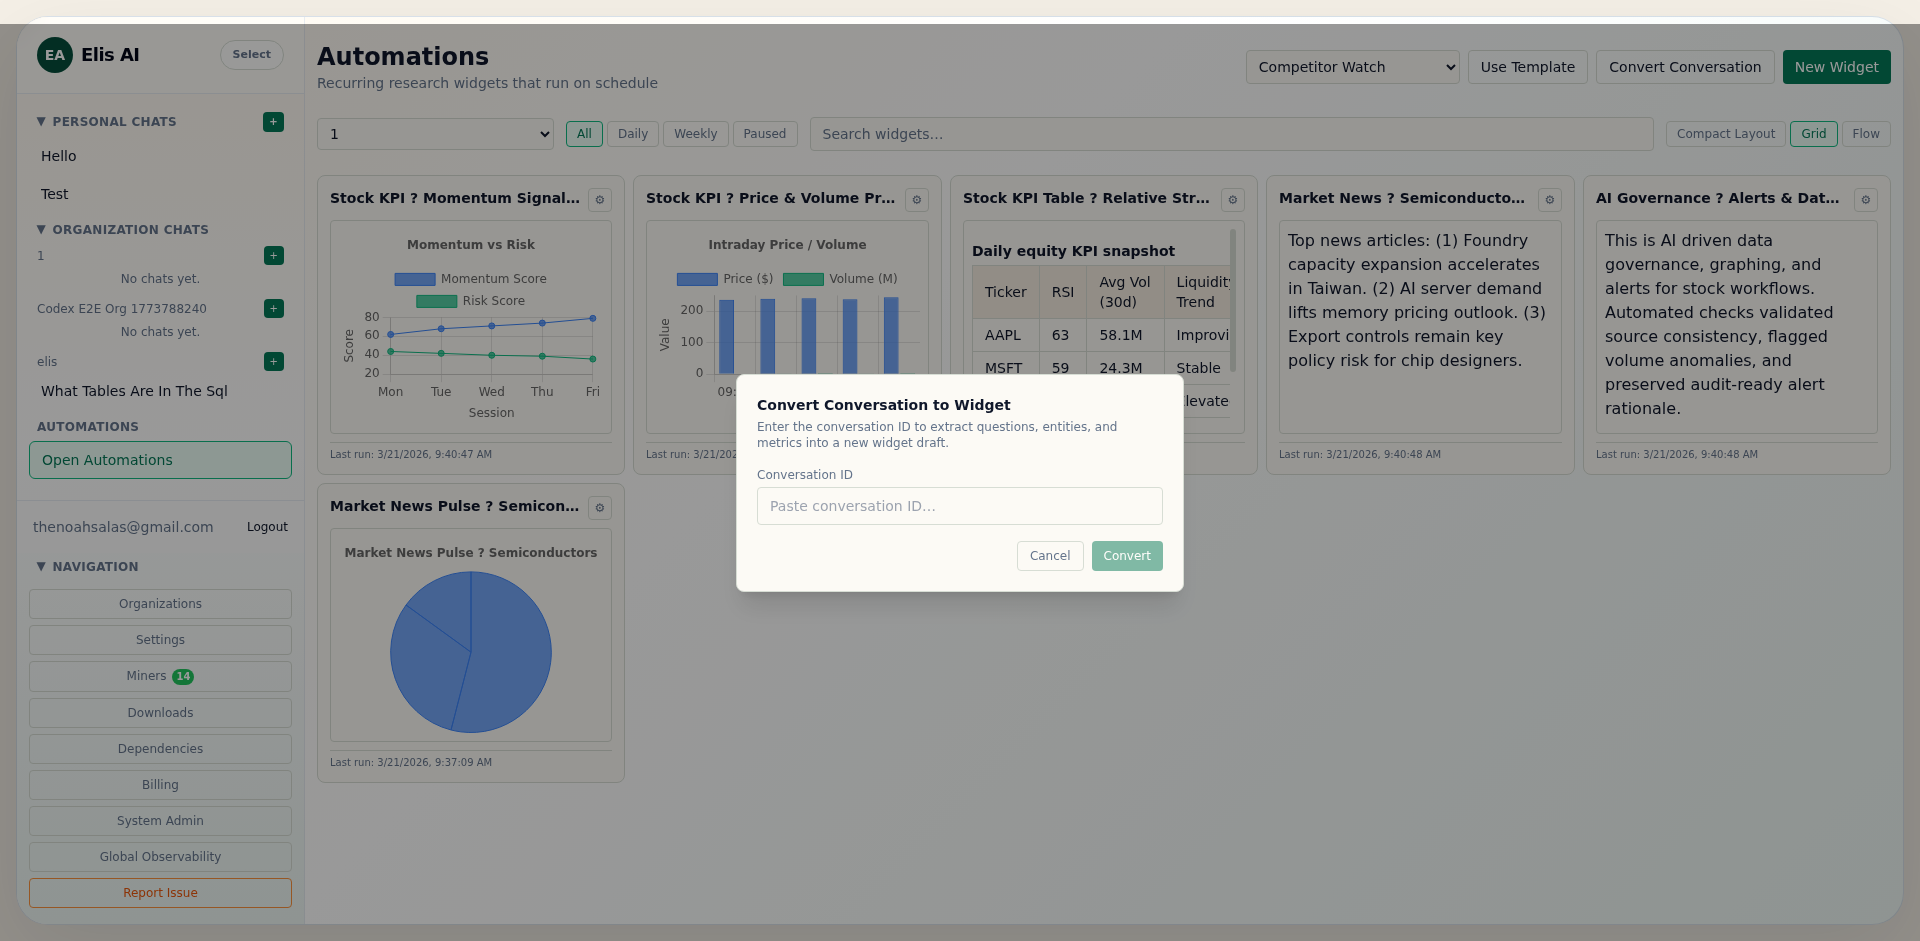
Convert a conversation into a widget
Have an existing research conversation you want to automate? Click Convert Conversation in the dashboard header, paste the conversation ID, and the system extracts questions, entities, and metrics into a widget draft for you to review and save.
Link widgets together
For advanced workflows, you can chain widgets so one triggers after another completes. Open the widget editor and expand the Advanced: Widget Linking section. Set an upstream widget ID and choose when to trigger: after success, or only when the upstream report has changes.
Switch to flow view
If you have linked widgets, switch from Grid to Flow view using the toggle above the widget grid. This shows your widgets as a dependency graph with connecting arrows, making it easy to see how data flows between research stages.
Test alert delivery instantly
In the widget editor, open Notification Dispatch, configure recipients/criteria, then click Test Alert Now to verify email delivery before waiting for a scheduled run.

Export reports to PDF or Excel
Download any widget report for offline sharing or archival. On the widget card, open the context menu (…) and choose ↓ PDF or ↓ Excel. You can also find download buttons in the widget detail drawer under the Reports tab.
- PDF — Styled document with headers, content blocks, and chart images.
- Excel — Structured spreadsheet with data rows extracted from the report.
Connect organization datasources
Enrich widget research with private data by connecting external sources. In the widget editor, open the Data Sources section and click Add Datasource. Supported types:
- REST API — Provide a URL, method, headers, and optional body. The widget fetches data on each run.
- SQL Database — Enter a connection string (PostgreSQL, MySQL, MSSQL) and a query. Results are injected as context.
- Generic API — For other HTTP-based sources with custom authentication.
Datasource connections are scoped to your organization. Connection strings are encrypted at rest and decrypted only at query time.
Policy note: Disable Internet Access and trusted domain settings govern web-sourced tools, not linked REST API data source calls. For strict no external egress, disable or remove external REST API data sources.