Tutorial
Anomaly Dashboard
Filter and investigate anomalous runs flagged by the system.
1
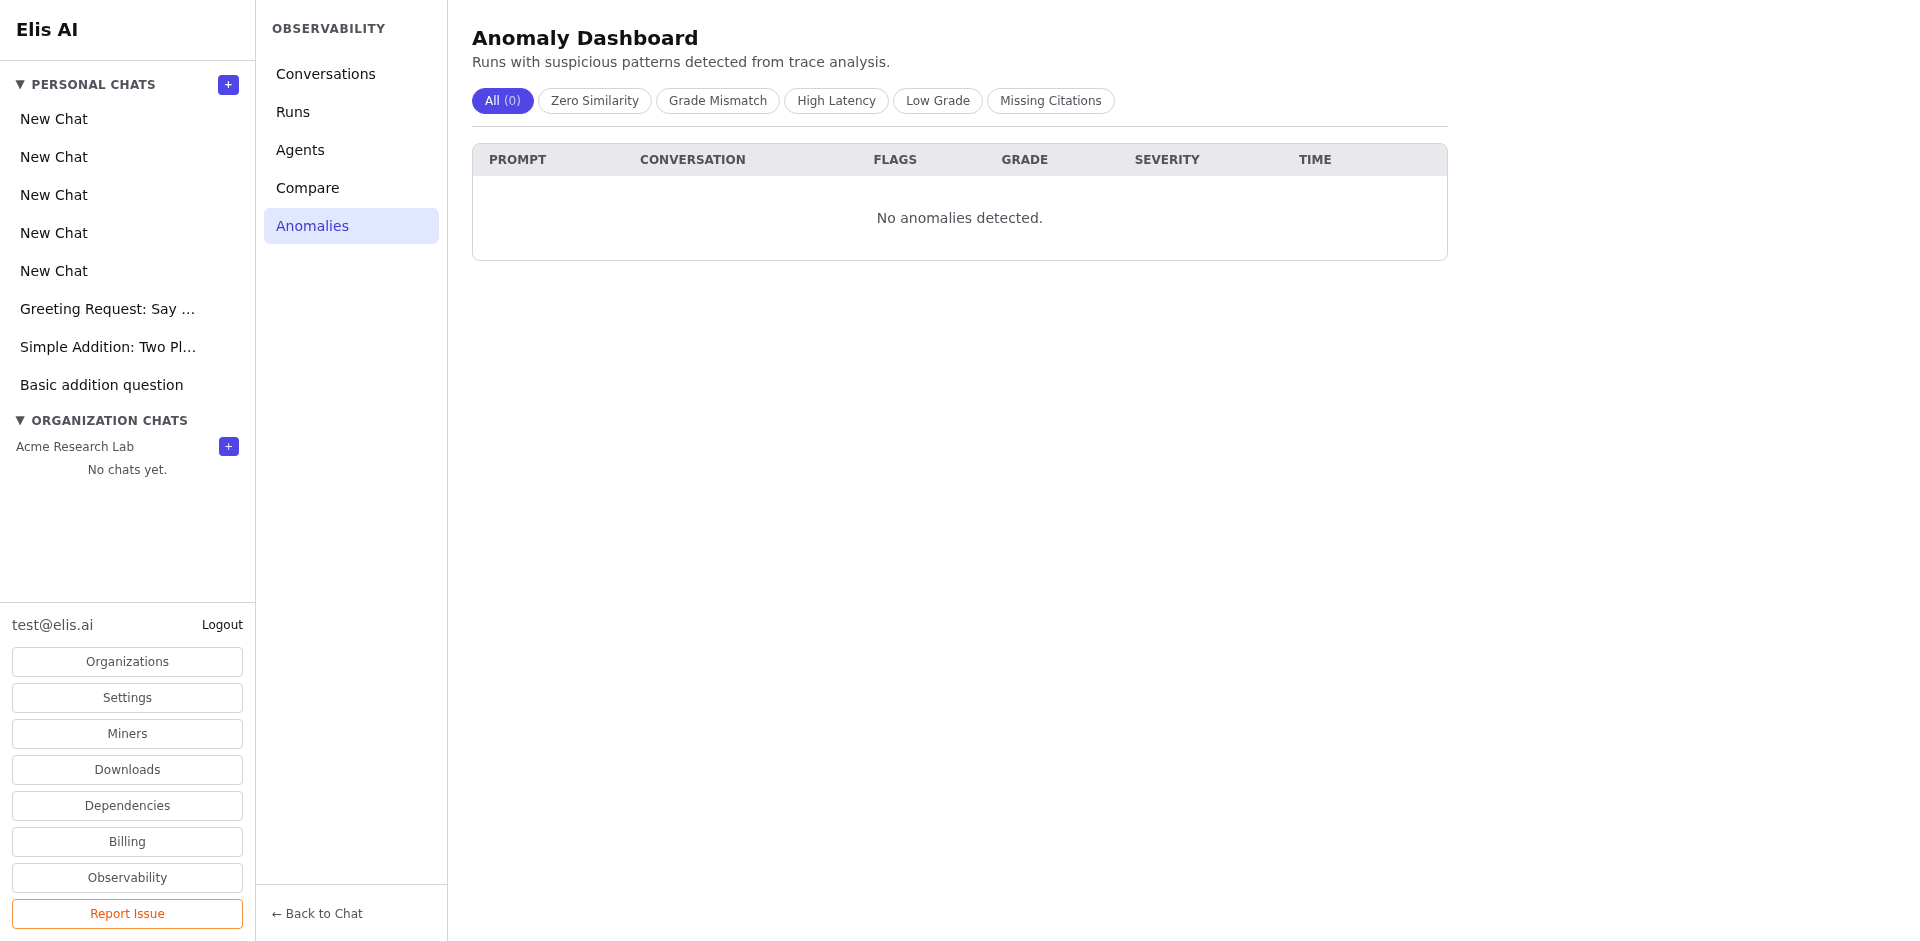
Open the Anomalies page
Click Anomalies under Observability. The dashboard lists all flagged runs sorted by severity.
2
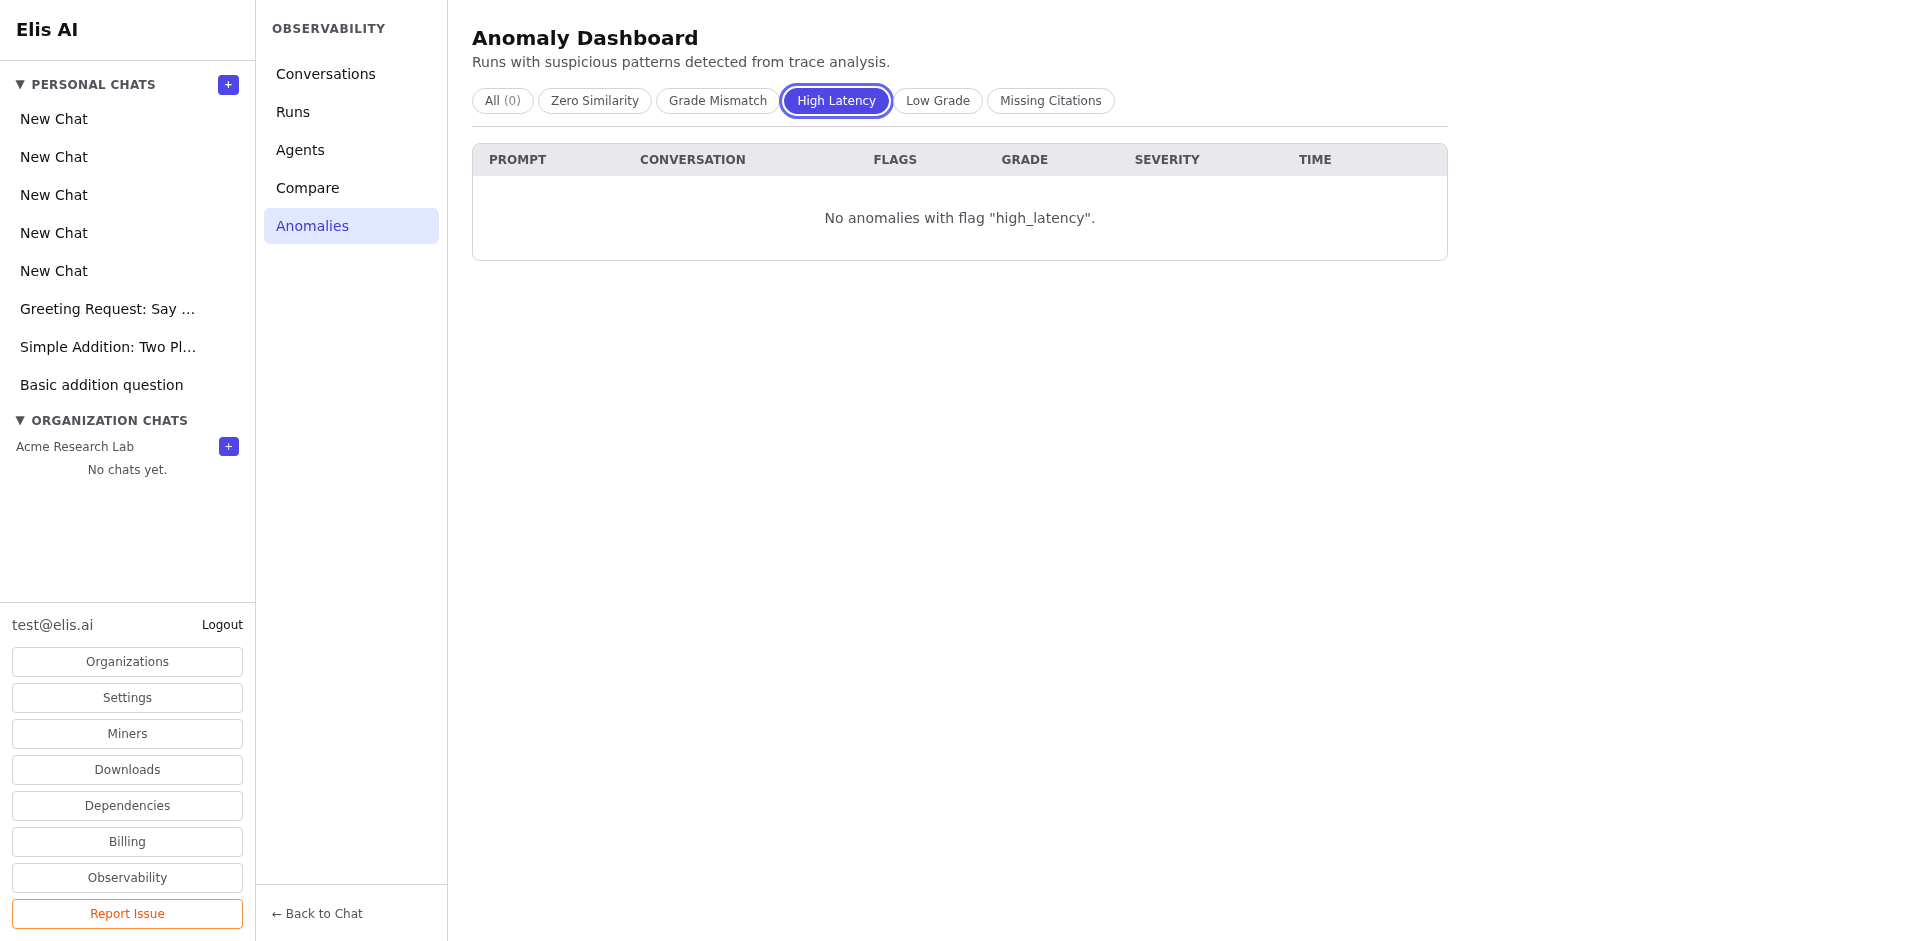
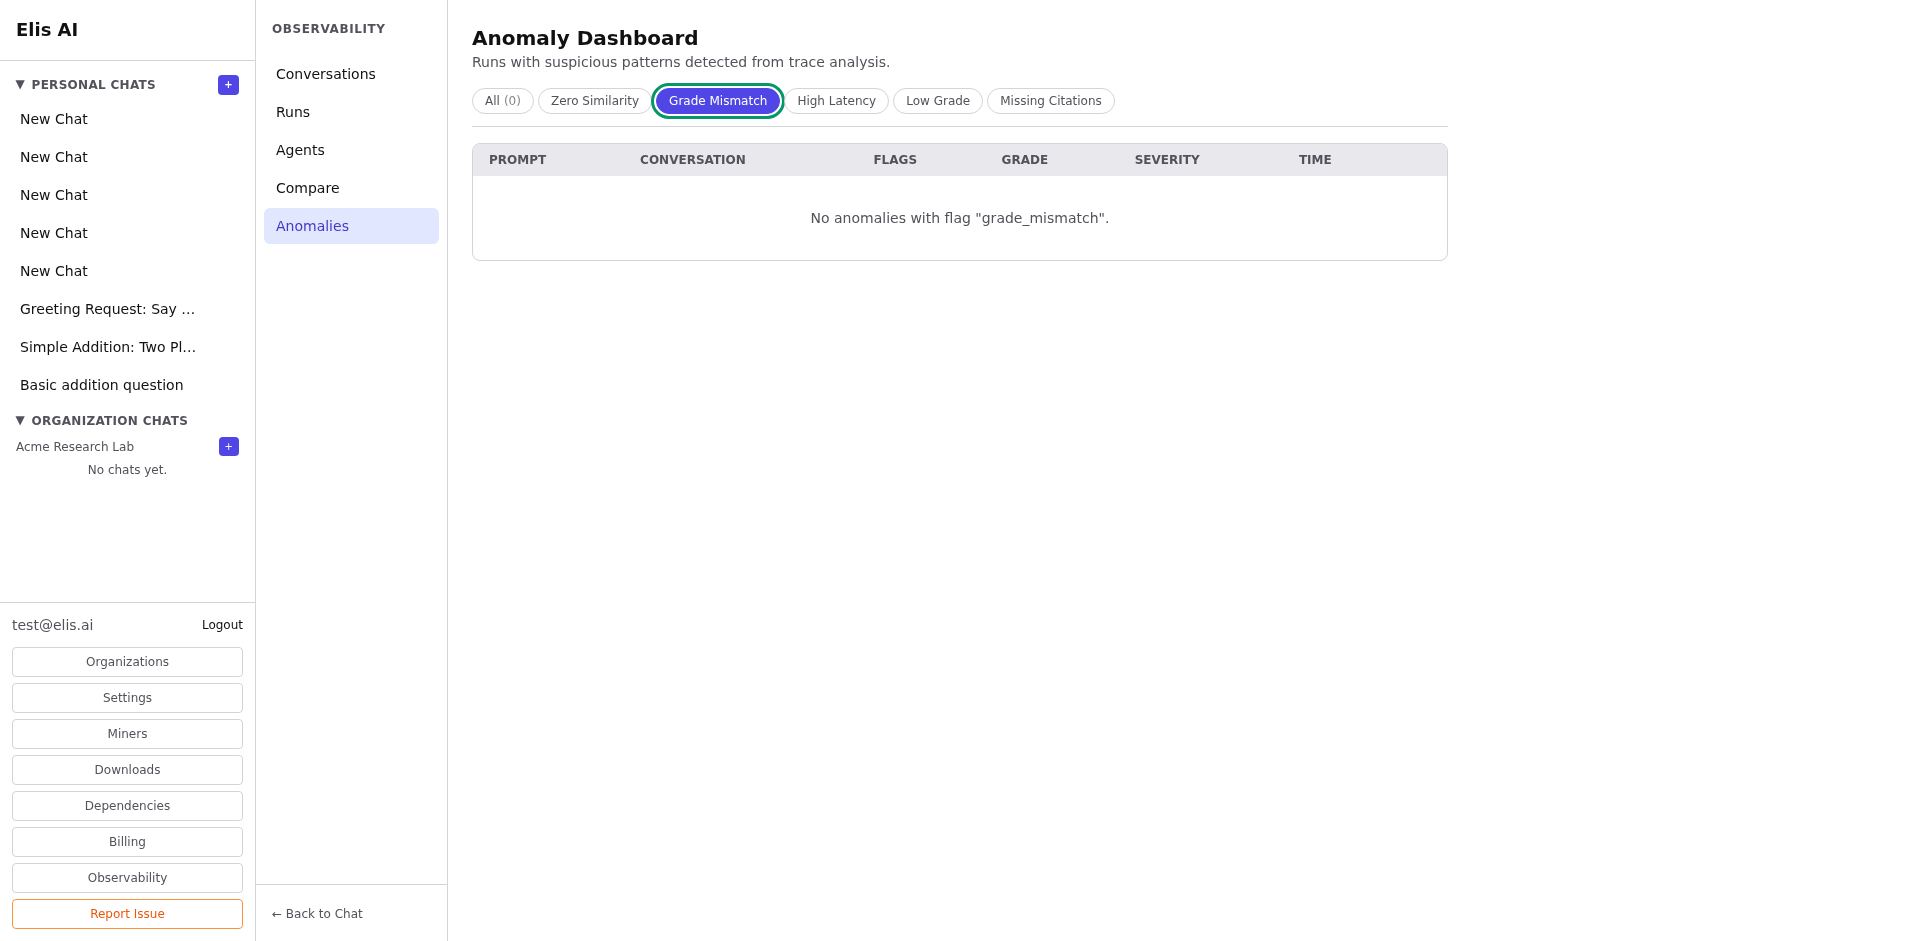
Filter by anomaly type
Use the type filter to narrow by category: consensus mismatch, quality drop, timeout, tool failure, or routing error.
3
Drill into a flagged run
Click an anomaly to see the full run detail with the specific issue highlighted. The anomaly card explains what was detected and the severity level.
Tip:Set up regular anomaly reviews (daily or weekly) to catch systemic issues early. Recurring anomalies of the same type often indicate a configuration problem.